Posts by OZ2OE

    Hi Chris, G4SDG,


    It will be interesting to see your measurements on the LimeSDR Mini. The two-tone signal I'm using, is the default "Tone" button on SDR Console.


    The 90% drive level is based on default SDR Console setting - and it also gives me 6 dB back-off.


    Some time ago I measured LimeSDR Mini output vs. drive setting in % and came up with the following curve measured at 2.4 GHz and for levels between 50 to 100%. Blue line is output and orange shows stepsize. (see also DD1US homepage under "What's new" of 20'th Nov. 2019)


    Output increases smoothly most of the time, but there are jumps of 2 to 4 dB at certain %-settings - which can make output adjustment a bit jumpy! Especially from 87 to 88% where output changes by 4dB. I don't know if all LimeSDRs behave the same? - maybe you could look into this?


    73 Ole

    Hi Dave - G0MRF


    Nice amplifier. And you're right, we all get more time for projects these days.


    Regarding my Spectrum Analyzer picture in message #2, output on 2.4 GHz is 0 dBm and spurious attenuation 55 dB. I used an SDR Console TX setting of 100% drive level and DC-offset of 200 kHz. Not recommended for QO-100 operation, I only used this setting for certain measurements.


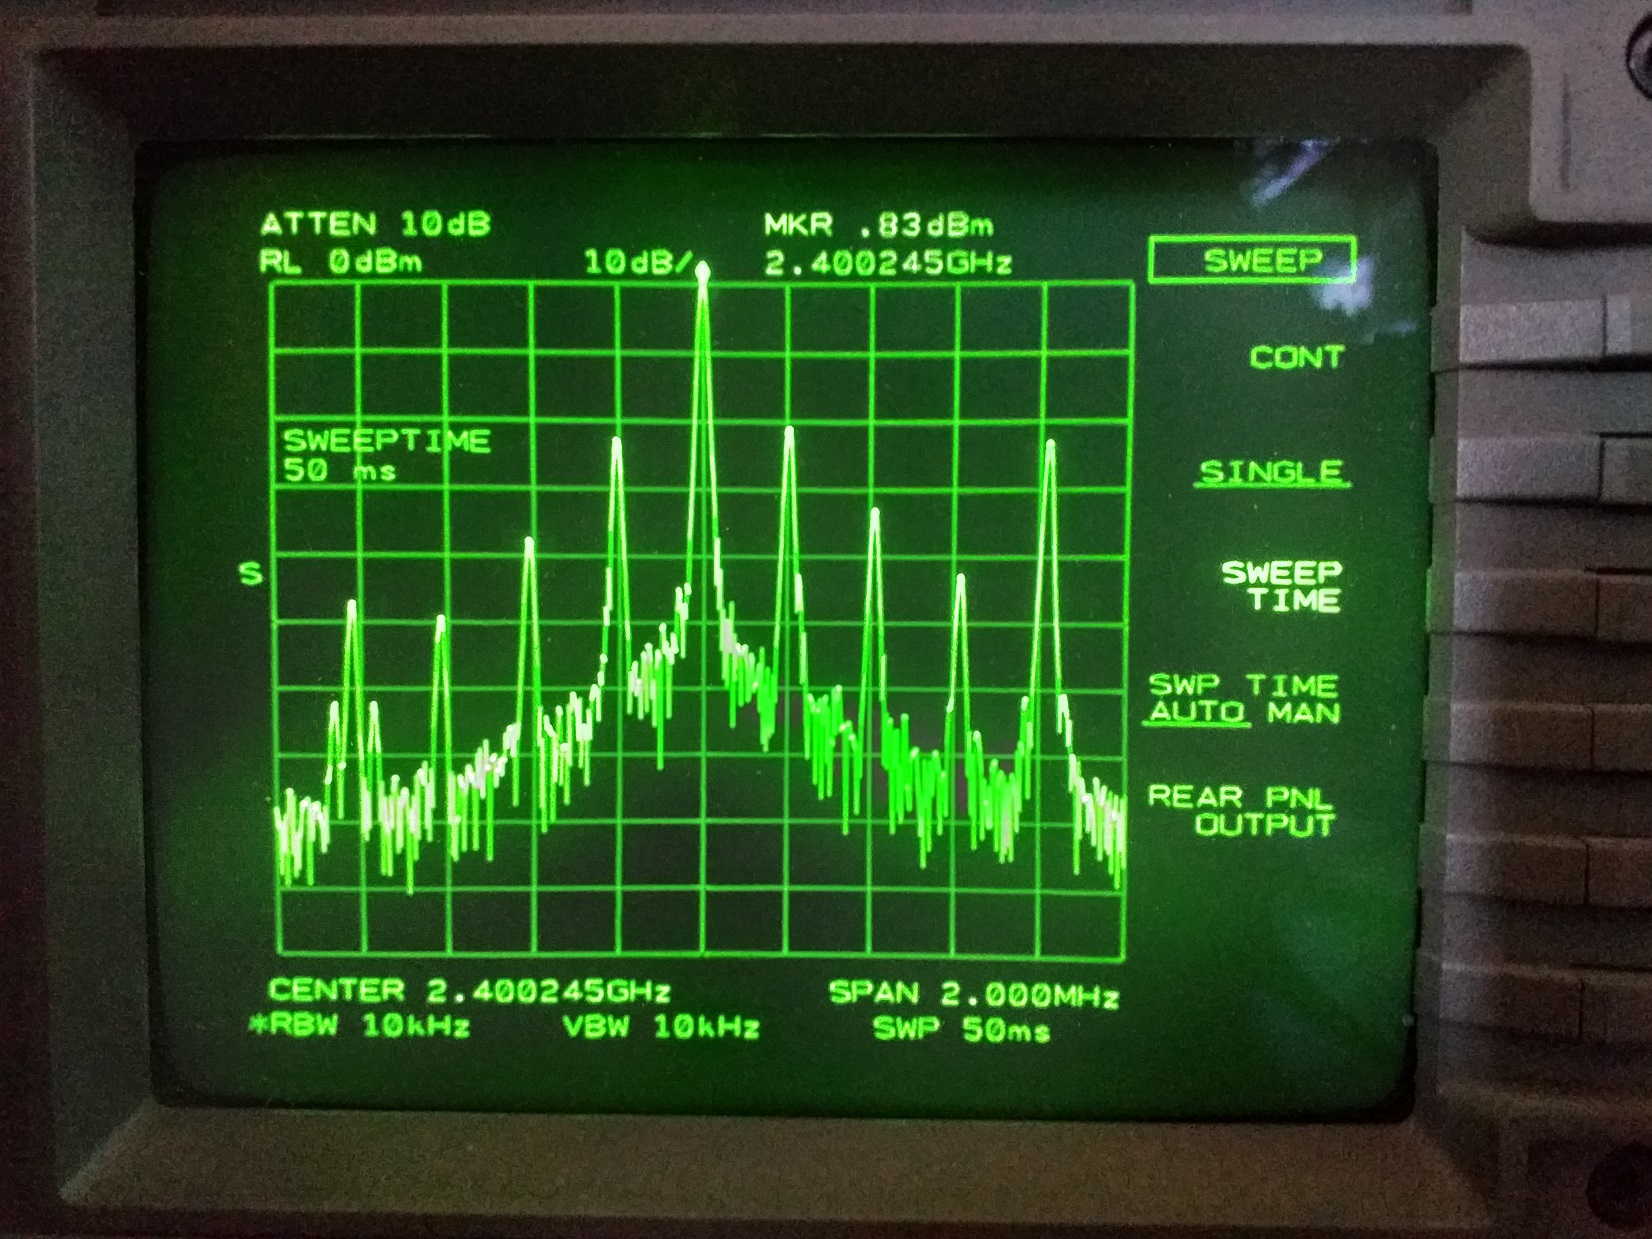
    What you see on 2.4 GHz at -22 dBc is actually an unwanted spurious 800 kHz above the wanted 2,4 GHz. Using a narrower span of 2 MHz all the close-in spuriouses show up! - and the -22 dB spurious you noticed is actually 800 kHz above the wanted frequency. See picture:


    In order to reduce the close-in spurious level, just reduce drivelevel to say 90% - that will help a lot! To completely remove them, set DC offset to 0 Hz, instead of my selection of 200 kHz. All the 200 kHz sidebands will collapse down to 0 Hz, ie. the carrier frequency. (DC offset selection is found under: Transmit/Options/Radio Configuration/LimeSDR/Calibration).


    Now with 90% drive and 0 Hz DC offset the spectrum looks like this - and note span is now only 10 kHz:


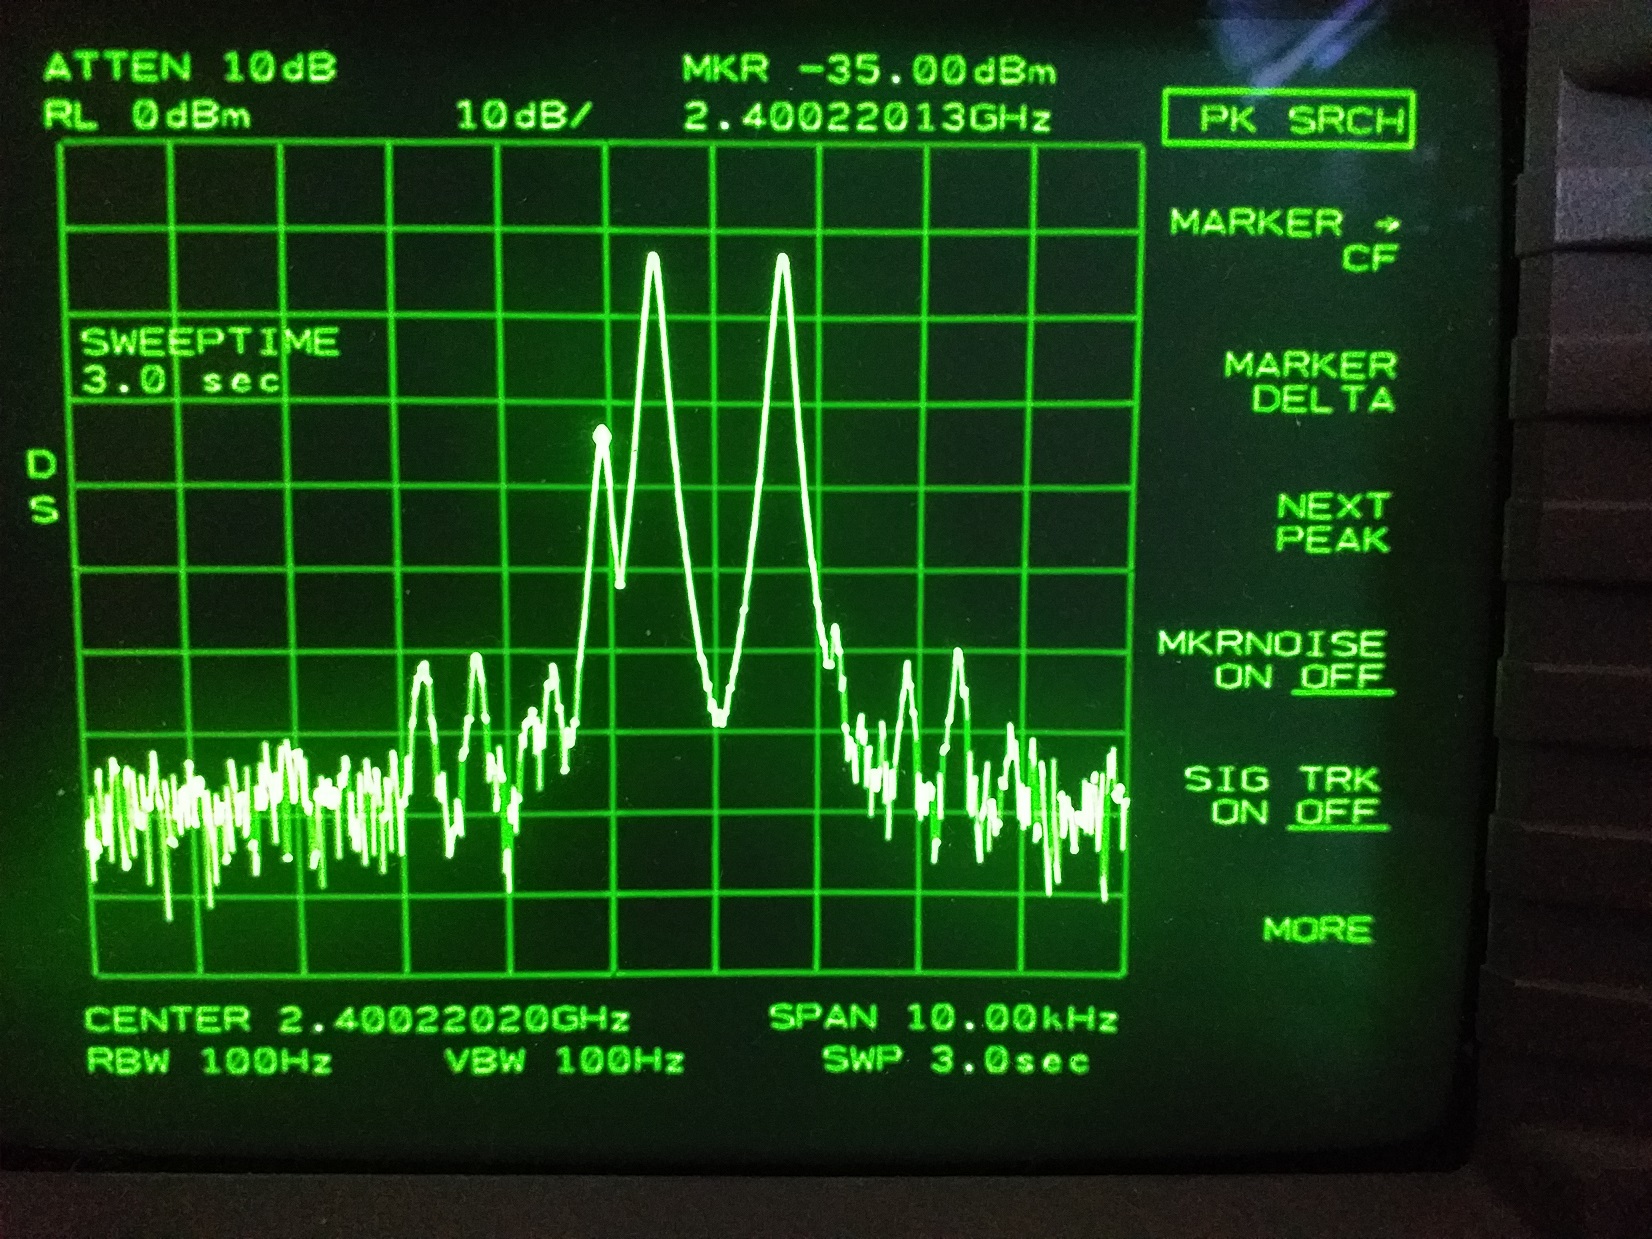
    There is now a "spurious" on 0 Hz - the carrier frequency - about -25 dB relative to PEP. I would prefer this to be -50 dB down, but don't know if possible at all with LimeSDR mini? Anyway it is not audible and may even serve as a tuning aid.


    In order to measure the two-signal IMD products, I use the DC offset function to move any "SDR-spuriouses" away from the wanted signal. With DC offset of 200 kHz they disappear from the picture and there is just the true two-signal IMD products at 90% drive level:


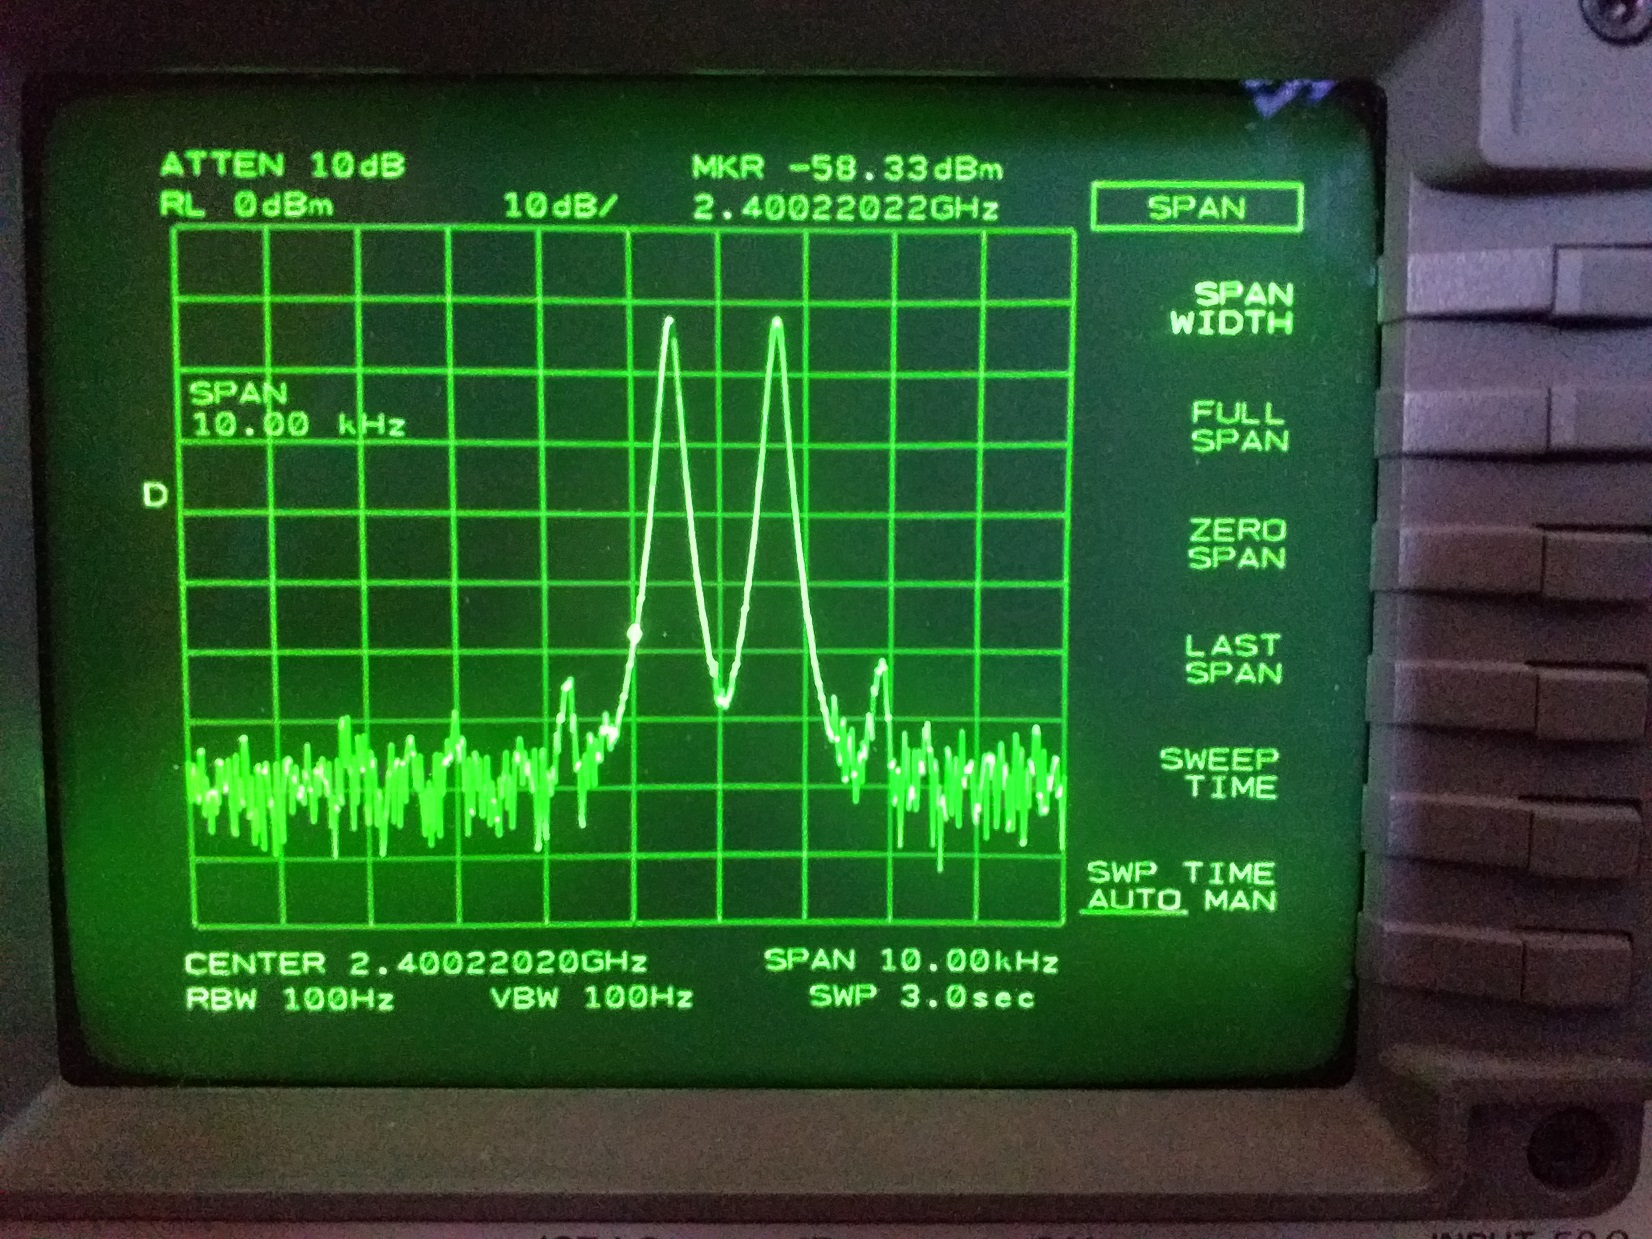
    Now, this is nice! 3'order IMD of -55 dB. However spuriouses are still there, just on other frequences.


    73 Ole

    Great solution! Filtering is always a good idea, as SDR transmitters can have annoying spuriouses at the output. The Lime SDR mini at 100% drive level - about 0 dBm output - have a spurious level of -55 dB or below.


    This is actually not too bad. Main spuriouses are spaced 40 MHz, so filter bandwith must be chosen accordingly. There are also close-in products not shown on this 500 MHz sweep.


    73 Ole OZ2OE

    The sun is again passing behind QO-100 these days - at least for us on middle northern latitudes. You can use: https://www.satellite-calculat…llite/suninterference.php to find the exact time. Today at 10:16:29 Goonhilly WebSDR had QO-100 and the sun aligned - within 0,16 degree - with an increase in noise floor as result. See attached recording covering about 20 min. Noise increase about 4 dB.


    On my 85 cm offset dish I measured a noise increase of 2,5 dB within the transponder BW. Outside the transponder noise, the increase was 4 dB.


    73 OZ2OE

    Hi Mike,


    I find it interesting that you mention QSB on the QO-100 beacon signals - and I have heard that commented before. Can you specify how much QSB you see? Like many others I also use the beacon signals for checking my setup, making ajustments, improvements etc., But I find the signals quite stable with variations less that half a decibel or so. (I have ofcourse seen greater variatinon during very heavy rain, but that is not something that happends often)


    Maybe we could find a time on the satellite to exchange observations?


    73 Ole OZ2OE

    Hi Roland

    I have also been wondering about the way SDR Console defines SNR and how this affects the SNR number we read off the screen. I found an explanation on Simons webpage:


    ""

    Noise Floor

    A few weeks previously a reasonable logic was implemented for measuring the noise floor. Purists will not be happy - they rarely are, but it works for me.

    Take the output from the SDR radio, ignore 15% of the bandwidth at the high and low end of the output to avoid the ant-alias filtering, and we're left with a healthy 70% of the signal. Now sort the FFT bins by value, take the mean of the lowest 10% and that's the noise floor.

    ""


    Reading this doesn't fully explains the changing values vs. changing display bandwith, but at least it shows a different approach to "defining" noise level - hi.


    For what it's worth, I see the introduction of SNR reporting on satellite signals as a step forward. So thanks for putting that into SDR Console - even if noise bandwith is "undefined" and displayed numbers seems too high.


    73 Ole OZ2OE

    I also measure 3 dB lower signal on upper beacon, but then noise floor is 2 dB lower around upper beacon, so SNR is not too different between the two.

    Furthermore with my 85 cm dish, noise floor around upper beacon is only raised 2 dB above system noise floor, which means I see both transponder noise and a large contribution from system noise. A bigger antenna may have exactly same signal/noise ratio on both beacons.


    By the way interesting how mark/space is inverted on upper beacon compared to lower. I guess this is to put space frequency on lower at exactly 10489,500 MHz and at the same time have space on upper at 10490,000 MHz?


    73 Ole OZ2OE

    Hi


    I'm using signal from the CW beacon as a mean for testing short term stability of my reference frequencies. Looking at the 5 sec dashes on a waterfall, I see straight lines (vertical on my SDR setup). But when the frequency scale is expanded to something like 100 Hz per cm - or more - the line is not always straight and with sharp edges. Sometimes - depending on stability of the reference - I see either wobble or fuzzy edges. This is not a strict measurement of stability, but it gives an visual indication, especially when comparing various references. (note that setting of the FFT BW must not be too narrow, as this will integrate/mask short term variations)


    Ofcourse the CW beacon itself has to be stable and clean - and it is - otherwise you don't know what is measured. I don't know just how stable the beacon is, but when I compare to other carriers (test transmissions) on the satellite, I almost never see signals as stable.


    Using this method I have tested OCXO's from KVG, Telequartz, TDK but also cheap TCXO's from the internet and a Rubidium standard. Clearly the best was an old TDK OCXO, followed by the Rubidium with OCXO's from KVG and Telequartz marginally worse. The cheap TCXO was very bad, but even this gave perfectly sounding SSB reception. Stability is only critical for certain modes!


    Ufortunately I have no Leo Bodnar to compare with.


    73 Ole

    For me the maximum solar interference will be on the 13'th at 11:57 local (09:57 UTC). Interference is also observable 2-3 days before and after the max. event. Last time - half a year ago - I observed something like 5-6 dB increase in background noise looking 500 kHz below the transponder. This time I will watch the effect inside the transponder BW, which will be different due to transponders own noise floor.


    73 Ole

    Hi all


    I have measured about 2 dB higher gain on the "4W" than on the "8W" amplifier. I believe it is due to difference in loading impeadance of the two active devices - which are visibly different. When designing amplifiers you can chose to maximize Pout or Gain - or have some compromise in between. I believe there is a reason for the two versions to exist.


    73 Ole

    Hi Mike, G0MJW - my dish is a 60 cm TRIAX with f/D 0.6. My measurements does not show that the POTY is better without the dielectric lens - on the contrary, as others have reported. When I assemble my next POTY, I'll measure the lens effect more closely.


    My Y-factor measurement was done on POTY both with and without dielectry lens. I make these measurement on the LNB+feed combination alone - so no dish involved. Ideally the Y-factor should not change from narrowing the beamwidth, as long a the LNB sees either cold sky or hot ground within the actual beamwith. I believe the small reduction in Y-factor with the lens is due to losses in the dielectric material. (theoretically could also be due to changes to side-/backlobes)


    73 Ole

    The POTY also have a 10 GHz "side". I have measured LNB performance with the original LNB feedhorn and with the POTY feed on the LNB - after cutting off the original horn.


    First measurement is Y-factor (difference in cold sky/hot ground).

    Original feed: 4.9 dB

    POTY (without dielectric lens): 3.7 dB

    POTY with dielectric lens: 3.3 dB


    Second measurement is transponder noisefloor (60 cm offset dish)

    Original feed: 2.9 dB

    POTY with dielectric lens: 1.8 dB


    Noise measurements are done with averaging, so accuracy is about 0.1 dB. Both Y-factor and transponder noise floor involves other parameters than just LNB NF or antenna gain. So there is no direct one-to-one dB relation to the POTY performance.


    The degradation in performance with the POTY is measureable, but any dual band antenna is a compromise. This is compensated by only having to use one antenna.


    Anyone else with similar observations?


    73 Ole

    Rain attenuation in dB/km can be seen below. From the graph it is clear that 2.4 GHz is not much affected by rain. (except when water gets into the feed itself and ruins the matching).


    For 10 GHz it can be a problem, but then it has to pour down. There are lot of information on Sat-TV and rain attenuation on the internet. One report stating that: "For Western Europe rain attenuation only excees a couple of dB in 0.1% of time".


    73 Ole


    Hi DO1CTL - I bought a similar 1 W amplifier and took this gain measurement of the unmodified amplifier. For 2400 MHz use it needs serious modifications!!


    73 OZ2OE


    The broadband disturbances on the 4'th of April was associated with pulses having a centerfrequency of 10489,497,125 Hz - as seen on lower waterfall on this HDSDR screenshot. I have no idea what this was?


    73 Ole